Learn About Air Pollution!
About us
Air pollution has become a key issue worldwide in the 21st century. We hear on the news day after about how little amount of time we have left before it is “too late”.This project aims to address and solve this problem, to clearly highlight and teach users about the air pollution levels in Glasgow and how to reduce them.
How to Use
On the main page you can find 4 different menus all showing different information:
- Top Right: Here is the main options window. This allows you to select a pollutant type , a specific date (currently going back to the 1st Jan 2019) or change how the heatmap grid appears onscreen.
- Bottom Right: The legend for the coloured grid is located at the bottom right of the screen. This tells you what the colours displayed represent in terms of pollutant level.
- Bottom Centre: This sets the hour you want to be displayed on the map, moving this slider along will change what time of day is being shown.
- Bottom Left: This table displays the pollutant level obtained by the respective station at the selected time. These can be hovered over or clicked to centre the map on it's location.
Air Pollution
Air pollution is the exposure of toxic gases to the atmosphere and thus to the air we breathe in. Most people believe air pollution began at the start of the Industrial Revolution, but some argue that it started with the beginning of agriculture some 11,000 years ago. The Industrial Revolution in 1760 significantly increased the number of gases being pumped into the air and eventually led to the need for action to be taken. The Great Smog of 1952 happened in London and was caused by an excess of pollution in the air and an anticyclone making the air stagnate and a thick smog to appear. This smog was dense and highly toxic leading to public transport and even indoor events to be cancelled. This led to a then recorded 4000 people dying due to inhaling the polluted air, but studies show this number could have increased to 12,000 in the following months.
Nitrogen dioxide
| Safe Level | Unsafe Level | Dangerous Level |
|---|---|---|
| 0-50 | 51-150 | 150+ |
Nitrogen dioxide is a member of the highly reactive gases known as nitrogen oxides(NOx). It is formed primarily through the burning of fossil fuels in combustion engines such as road traffic. Prolonged exposure to nitrogen dioxide can lead to respiratory issues such as asthma , with children and the eldery most at risk to the gas. Work is being done to reduce nitrogen dioxide pollution with electric cars and renewable energy leading the way.
Particulate Matter 10
| Safe Level | Unsafe Level | Dangerous Level |
|---|---|---|
| 0-50 | 51-80 | 81+ |
Particulate Matter (also known as PM) describes the solid and liquid particles found in the air. Many of these particles are usually the result of toxic gases being released - due to pollution. Some of the particles can be seen by the human eye while others can only be seen under a microscope. Particulate matter is classed by its diameter, with PM10 being particles with a diameter of 10 micrometres or smaller and PM2.5 particles being 2.5 micrometres or smaller.
Sensors
Diffusion Tubes
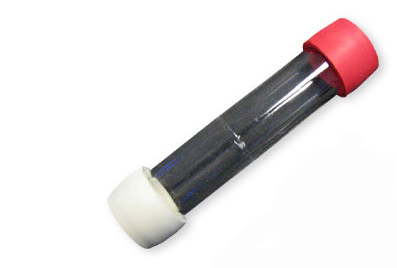
One of the main pieces of equipment used to manually measure air pollution is Diffusion Tubes. These are small plastic tubes with a cap on each end, one of which is coloured. Inside the tube is a mesh disc coated in Triethanolamine (TEA), a chemical that can absorb Nitrogen Dioxide. The tubes can measure the amount of Nitrogen Dioxide (NO2) in the air, usually over a 2-4-week period. After the period, the mesh is examined to see how much of the chemical coating has reacted with NO2 in the air. Tubes are set up vertically, with the coloured cap facing upwards, up at the top of a lamppost or sign. The bottom white cap is then removed, and the reaction will start, the tube must be left stationary for the period. When retrieving the tube, the white cap is replaced, and it is taken to a lab for analysis. The mesh is washed and then examined under a UV light with the amount of light absorbed being the amount of nitrogen dioxide present in the subject.

Gravimetric Samplers
Measuring particulate matter can be challenging due to the microscopic size of the particles being investigated. This means different techniques must be used to determine the amount of particulate matter in the air, without relying on microscopes and a tally being available. The Gravimetric method solves this problem, while returning an accurate representation of the particles nearby. A common model for this method is a tube with a funnel on top. The funnel is open apart from a rain hat on top and a bug screen around the side, this lets only air particles into the tube. These particles go down the tube and through the filters of different sizes. Whatever filter the particle lands on and is not able to fit through will help determine the size of the particle. When the test is complete these filters are weighed and compared to the weight before the experiment, the difference being a representative of the particulate matter present.
